

Countries Resized by Cost of Living (1950–2026)






What would the world look like if countries were resized by their cost of living? Explore the changing map and top-15 ranking from 1950 to 2026. Press play, drag the timeline, or choose a country on the map to see its value.
The numbers are a household-consumption price-level index, with the United States set to 100 separately in each year. A value of 150 means the modeled price level is about 50% above the US level at that date. This compares prices across countries; it does not measure wages, purchasing power of local households, inflation over time, or overall affordability.
Reading the map
The bars show the actual index. To make changes visible while keeping the world recognizable, the map deliberately amplifies resizing: each country's equal-area geographic footprint is multiplied by (index / 100)^1.7. Map area is therefore an illustration, not a literal price-index scale. Present-day borders and flags stay in place throughout the animation. The map includes 229 countries and territories; the top-15 ranking draws from 198 sovereign or disputed-country entities, matching the video.
The 2026 endpoint is a projection. Earlier missing histories are reconstructed from regional trends and related-country data, so older rankings are less certain than recent ones. Values and shapes between annual observations are animated transitions rather than measured monthly data.
Sources and methods
- Penn World Table 11.0, household-consumption price level (
pl_c), through 2023. - World Bank household price-level index, used to extend country trends through 2025 where available. Missing recent observations use regional changes.
- The 2026 values extend the recent trend at half strength, capped at a 10% annual change. They are estimates, not observations.
- Country outlines are based on Natural Earth. The map uses the Gastner–Seguy–More cartogram method.
Explore more in Visuals, including countries resized by economic size, Europe’s population, and the history of currencies.
Timeline summary and key events
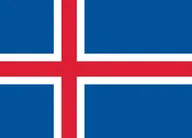
In Jan 1950, the leading Countries in this dataset were Argentina (166.5), Guyana (146.1), Brazil (136.5). By Jan 2026, the leaders were Iceland (155.1), Switzerland (132.3), Barbados (130.0).
Sign in or create an account to comment.
0 comments
Be the first to share your perspective.