Follow the idea.
Check the numbers.

Good research takes both. TickerStat brings investor conversations and company financials together, so you can build your own view.

THE CONVERSATION

Ideas worth exploring.

Find a fresh perspective. Explore stock discussions, research, and the questions other investors are asking.

THE EVIDENCE

Numbers with a story.

Get to know the business behind the ticker. Explore its revenue, earnings, cash flow, and financial history.

The conversation continues below
+ Create post

Richest people 1984–2026

Explore more than four decades of changing fortunes, from the Japanese property boom to the rise of Bill Gates, Warren Buffett, Jeff Bezos and Elon Musk. Drag the timeline, choose a year or press play to follow the top 15 people shown in our richest-people film, from July 1984 to September 2026. Open the event cards for archival interviews, memorable business moments and unexpected humour, including a young Donald Trump on 60 Minutes, Bill Gates on Letterman, Facebook’s stock-market debut and Ga

Loading timeline…

Open full post →

10
1

Most valuable companies 1989–2026: an interactive history

Explore 37 years of the world’s most valuable companies. Scroll the timeline, jump to the events that changed markets, or press play to watch the top 15 trade places. Which change surprised you most? 31 May 1989–9 September 2026. Values are nominal US dollars. Public companies use market capitalization; private companies use disclosed funding or secondary-sale valuations. Historical gaps include estimates; animation between observations is interpolated. This interactive uses the same underlying

Loading timeline…

Open full post →

9
0

Most popular AI 2021–2026

Watch the AI boom unfold, from early writing assistants to ChatGPT, Gemini, Claude and DeepSeek. Scroll the timeline, choose a year or press play to explore how popular AI websites change places from January 2021 to September 2026. This is the interactive companion to our “Most Popular AI 2021–2026” video. Open the event cards for memorable launches, interviews, demonstrations and viral moments—from the original DALL·E avocado chair and Toy Jensen to ChatGPT, Sora and Will Smith’s spaghetti. Whi

Loading timeline…

Open full post →

7
0

Top car brands by production 1960–2026

Explore the history of car production from 1960 to 2026. Drag the timeline, choose a year or press play to watch the top 20 change places. Open the historical events for iconic launches, racing victories and turning points in the industry. This is the interactive companion to our “Top Car Brands by Production 1960–2026” video. From the Mustang and the Corolla to Le Mans, Senna and Hamilton, discover the stories alongside the numbers. Which car or moment would you add? Watch video About the data:

Loading timeline…

Open full post →

7
1

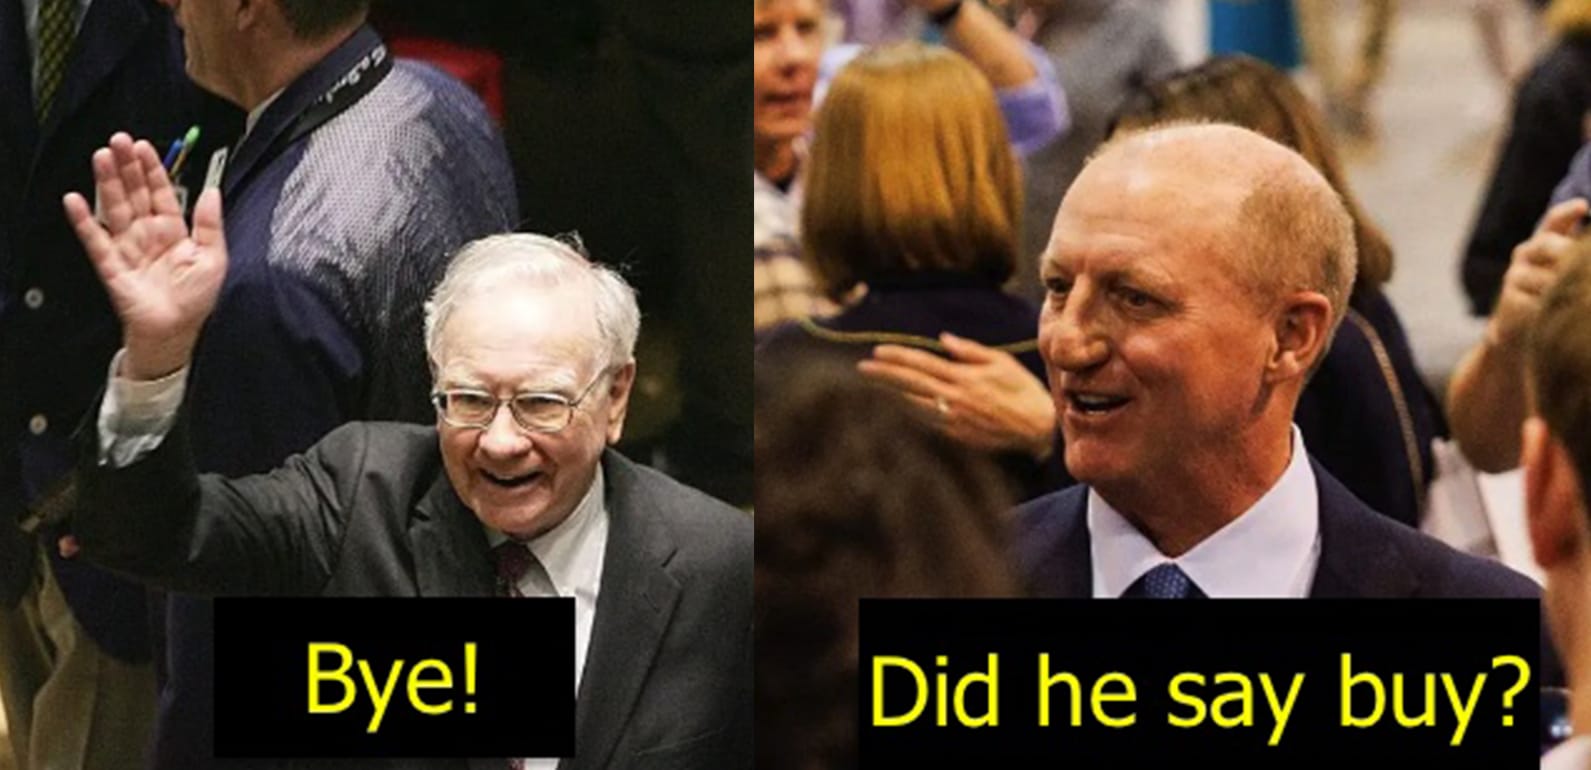
Berkshire finally spending cash? Or just spending the interest?

Every time Berkshire does something with its cash, the internet acts like Buffett or Abel finally hit the buy button after years of sitting in T-bills. But if the cash pile is earning a decent yield, they can spend the interest and still keep most of the optionality. That's less dramatic, but probably closer to how a giant balance sheet actually works. So what are we supposed to read into it? Are they seeing better opportunities, getting more aggressive, or just using cash flow that was already

Capital allocation meme
7
1

Nike feels like it lost the default setting

I keep noticing this... Nike used to be the answer when you needed sneakers or gym clothes. Now it feels like people are mixing Lululemon, Hoka, On, New Balance, Vuori, whatever. Maybe I'm just seeing my own bubble, but the brand doesn't feel as automatic as it did 10 years ago. And the fix seems to be more collabs, more limited drops, higher prices. That can make the brand look hot for a minute, but it doesn't solve “do people actually want the product?” For $NKE, what matters more right now: p

6
0

Every Currency on Earth: 2000 BC–2026

How did money travel from weighed silver to the currencies we use today? Explore more than 4,000 years with a changing world map, ten historical milestones and an animated ranking of the largest cities. Press play, drag the timeline or choose a milestone. The map follows the 4K film’s currency regions while the city ranking uses the same historical population series. Follow early electrum coinage, Roman silver, Chinese paper money, medieval gold, national currencies and the euro. How to read the

Loading timeline…

Open full post →

5
0

Largest Airlines by Passengers 1960–2026

Who carried the world? Explore the changing airline passenger rankings from 1960 to 2026, from Pan Am and the early jet age to the growth of low-cost carriers and today’s airline groups. Drag the timeline, choose a year or press play to follow the top 15 airlines shown in our film. This interactive companion lets you pause the race and compare passenger numbers at your own pace. Open the event cards for 22 moments in aviation history: the Boeing 747 and the jumbo era, Concorde’s supersonic servi

Loading timeline…

Open full post →

5
0

Is $ASO a real value setup, or are we just calling a falling retailer cheap?

I keep coming back to $ASO because it looks cheap for reasons that might be temporary — but “looks cheap” is also how a lot of value traps start. The basic setup is pretty simple. Academy Sports & Outdoors has been hit hard, the stock is trading around 6–7x forward earnings, and the market seems to be treating the post-COVID sales normalization as proof that the business is in permanent decline. Maybe that is right. But there are a few things that make the bear case less obvious than the multipl

5
0

AI revenue going to $200B by 2028... are we just making numbers up now?

Apparently one of the big frontier AI labs is talking about something like $200B in 2028 revenue after being around a $47B run rate earlier this year. I get the bull case. Every company wants this stuff, adoption is going nuts, etc. But 4x in two years is a huge jump, especially when models keep getting cheaper and the competition is everywhere. The part I can't get past is margins. Who actually keeps the money? The model company, the cloud provider, or the chip guys? If the price per token keep

5
0

Europe’s Population 1880–2026

How has Europe’s population changed since 1880? Explore more than 140 years through a top-15 ranking and a historical map, from the German and Russian empires to Europe in 2026. Press play, drag the timeline or choose a year to follow changing populations, borders and country identities. The chart and map share the same clock and population figures. Violet-to-peach shading shows where people are concentrated; historical flags follow the timeline. Use the country lookup to highlight smaller state

Loading timeline…

Open full post →

4
0

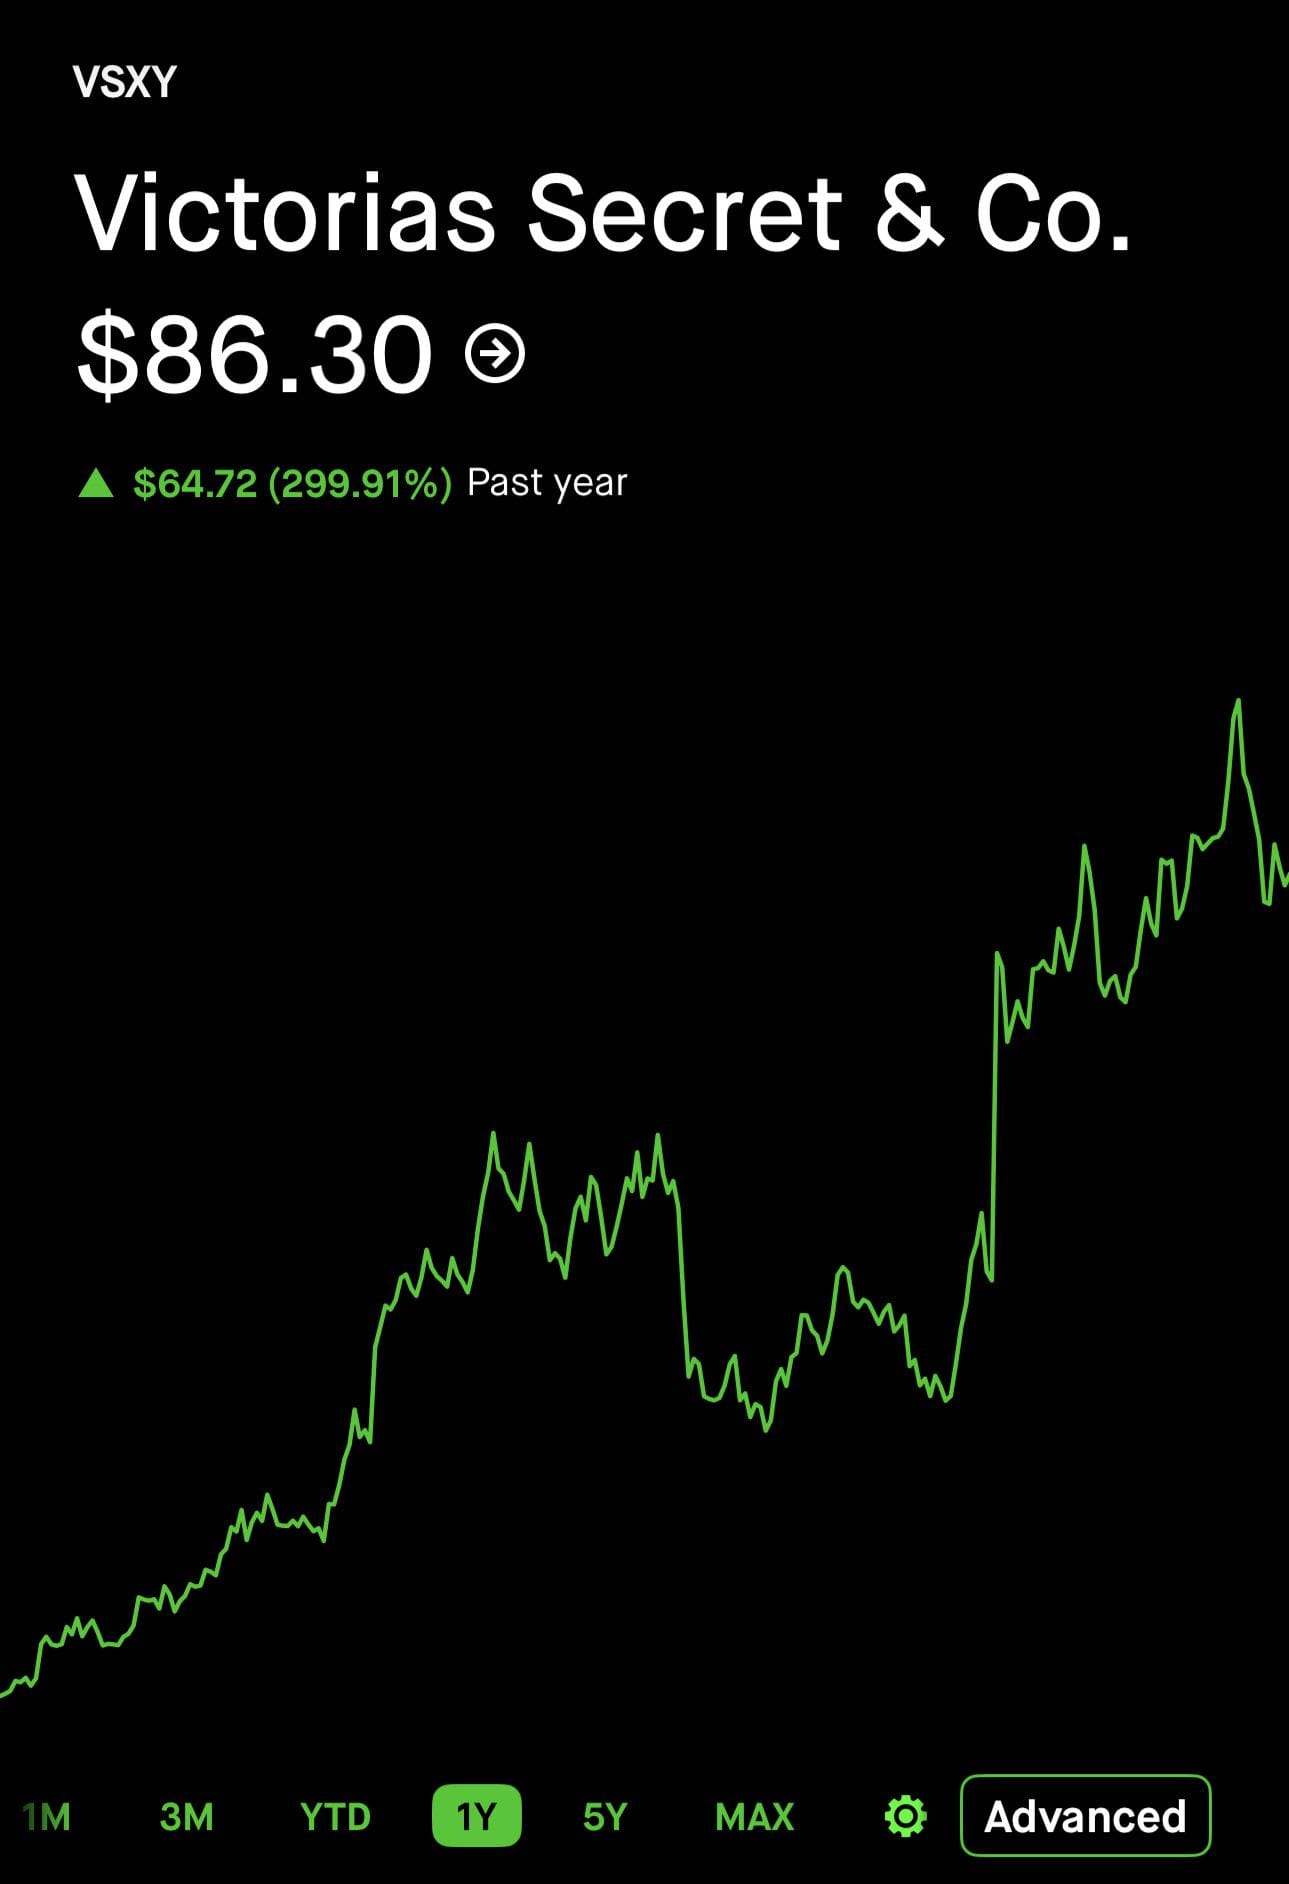
Are we ignoring everything that isn't AI?

Maybe AI is the right place to be. But it has become so easy to explain: AI demand goes up, buy the bottleneck, repeat. Meanwhile there are a bunch of boring consumer businesses where actual people are still changing what they buy. $VSCO, restaurants, gyms, beauty, discount retail, etc. Those stories are messier, so they get less attention. The problem is it's much harder to do the work. You have to figure out the customer, brand, competition, margins, and whether one good quarter is just noise.

Consumer market illustration
4
0

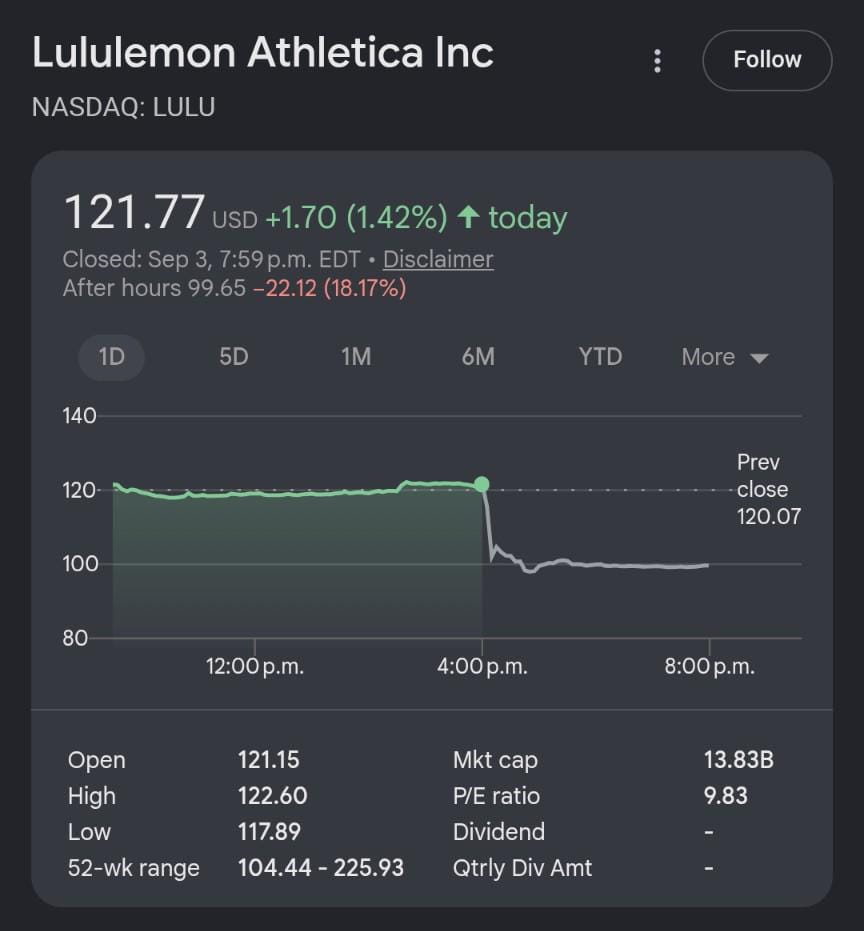
Can $LULU fix a rough quarter by adding AI to leggings?

$LULU has had a rough stretch and apparently the obvious fix is to announce an AI division. LuluAI. Large Legging Model. It scans your fit, predicts your squat form, and tells you whether the pants are going to survive the quarter. Maybe they put a data center in every store and call the power bill innovation. Honestly, the market would probably reward it for 48 hours. What is the most ridiculous “AI pivot” you have seen a company try?

LULU AI meme
3
0

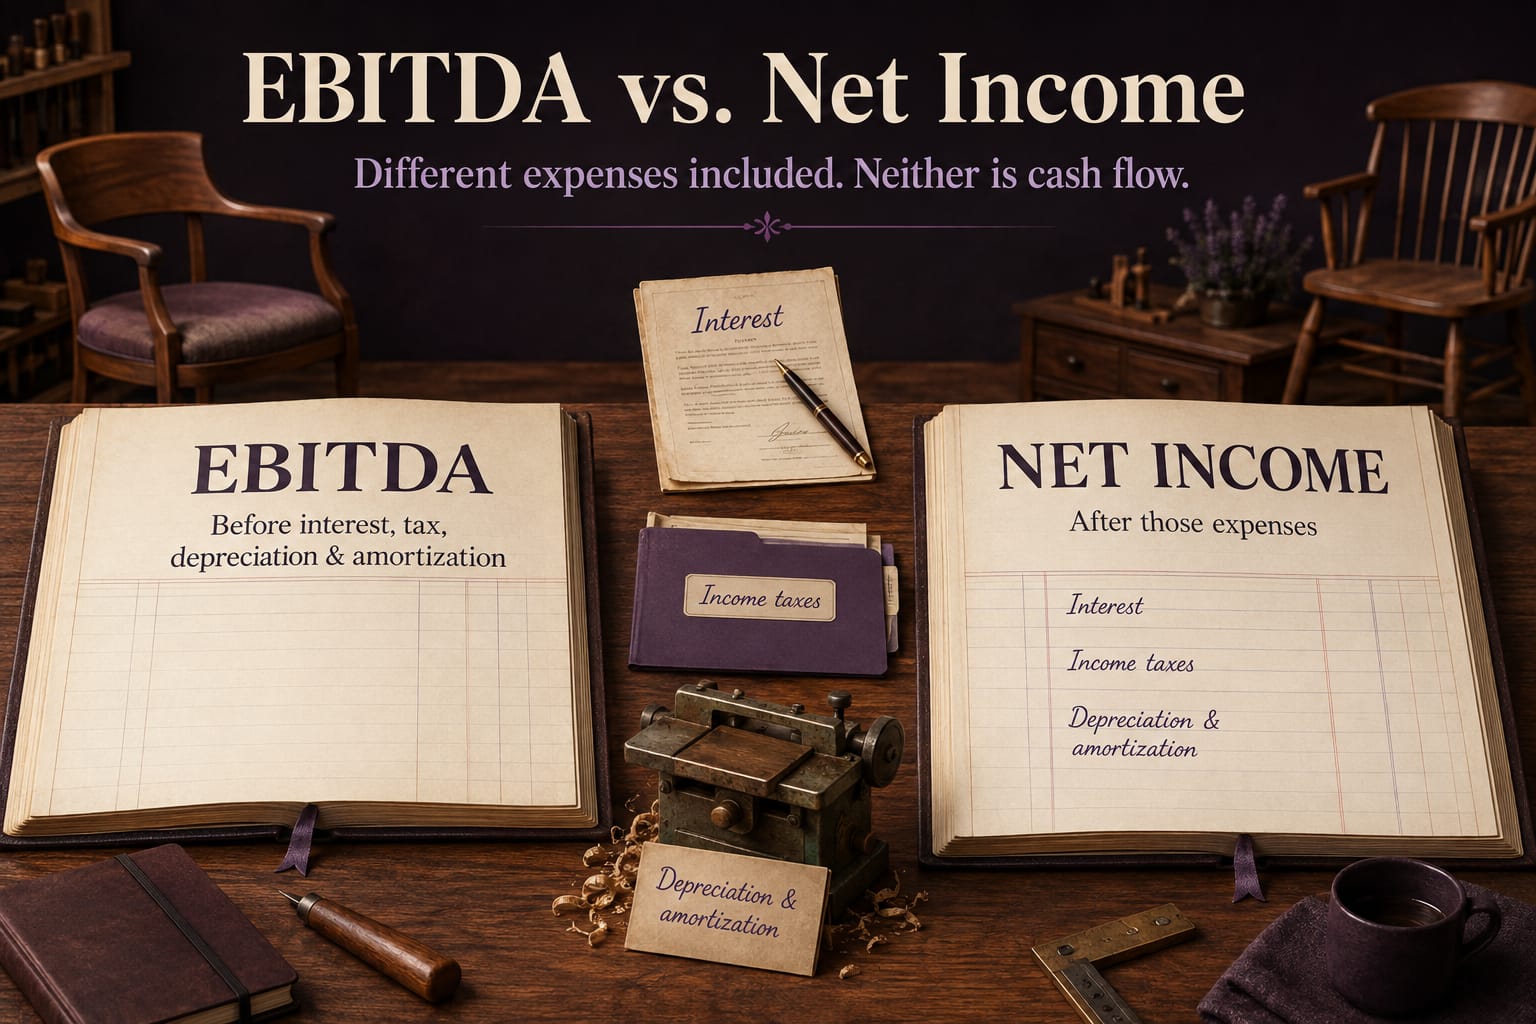
EBITDA vs. Net Income: What Each Measures—and What Both Miss

EBITDA measures earnings before interest, income taxes, depreciation, and amortization. Net income measures accounting profit after those items. The difference is which costs remain in the calculation—not which number represents cash. EBITDA can help compare businesses before certain financing and accounting effects; net income shows the resulting bottom-line profit or loss. Neither replaces a cash flow statement. 1 2 The most useful question is not “Which number is better?” It is “What explains

Two accounting ledgers show EBITDA before interest, income taxes, depreciation and amortization, and net income after those expenses.
1
0

Basic vs. Diluted EPS: Formulas, Examples, and What Investors Should Use

Basic earnings per share (EPS) divides earnings available to common shareholders by weighted-average common shares outstanding. Diluted EPS includes qualifying potential common shares and adjusts earnings when required. Both describe a reporting period—not a forecast of future earnings or every share that might eventually be issued. 1 4 For an initial stock analysis, start with reported diluted EPS, then use basic EPS and the share-count reconciliation to understand the difference. This guide fo

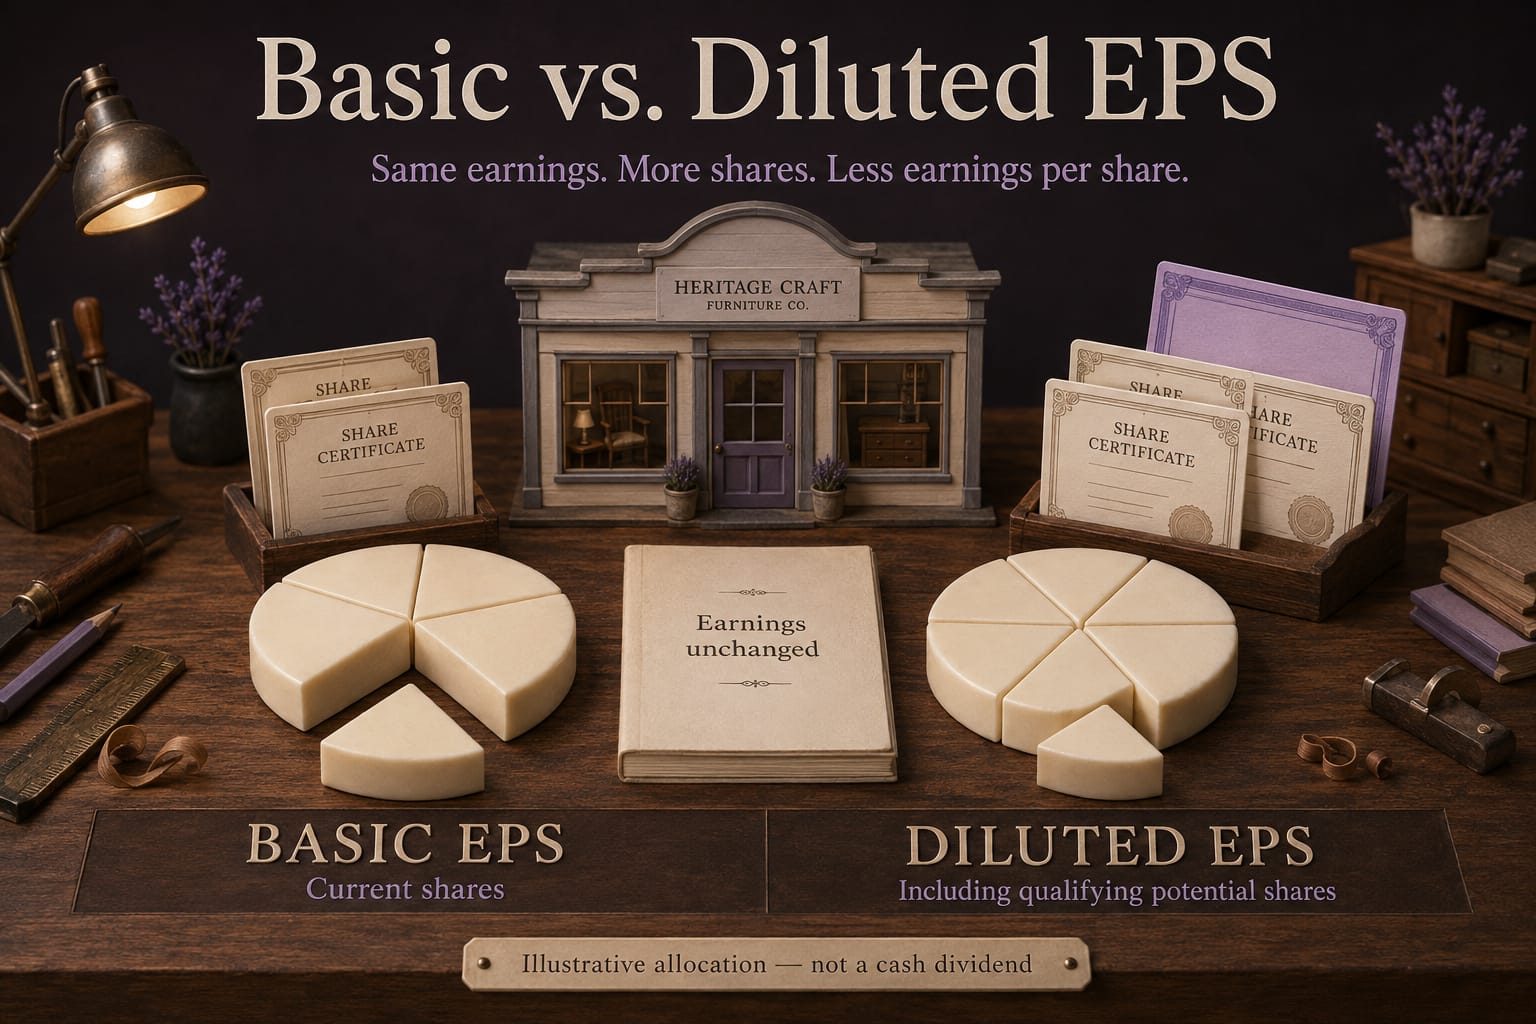
Basic and diluted EPS illustrated as the same accounting earnings allocated across current and qualifying potential shares.
1
0

Free Cash Flow vs. Net Income: Differences, Formulas, and Examples

Net income measures accounting profit. Free cash flow measures operating cash flow after capital expenditures, using the definition in this guide. They answer different questions: whether a company reported a profit and how much operating cash remained after capital investment. A company can be profitable without generating positive free cash flow. 1 2 The useful question is not simply which number is higher. It is what explains the difference—and whether that explanation is likely to repeat. Th

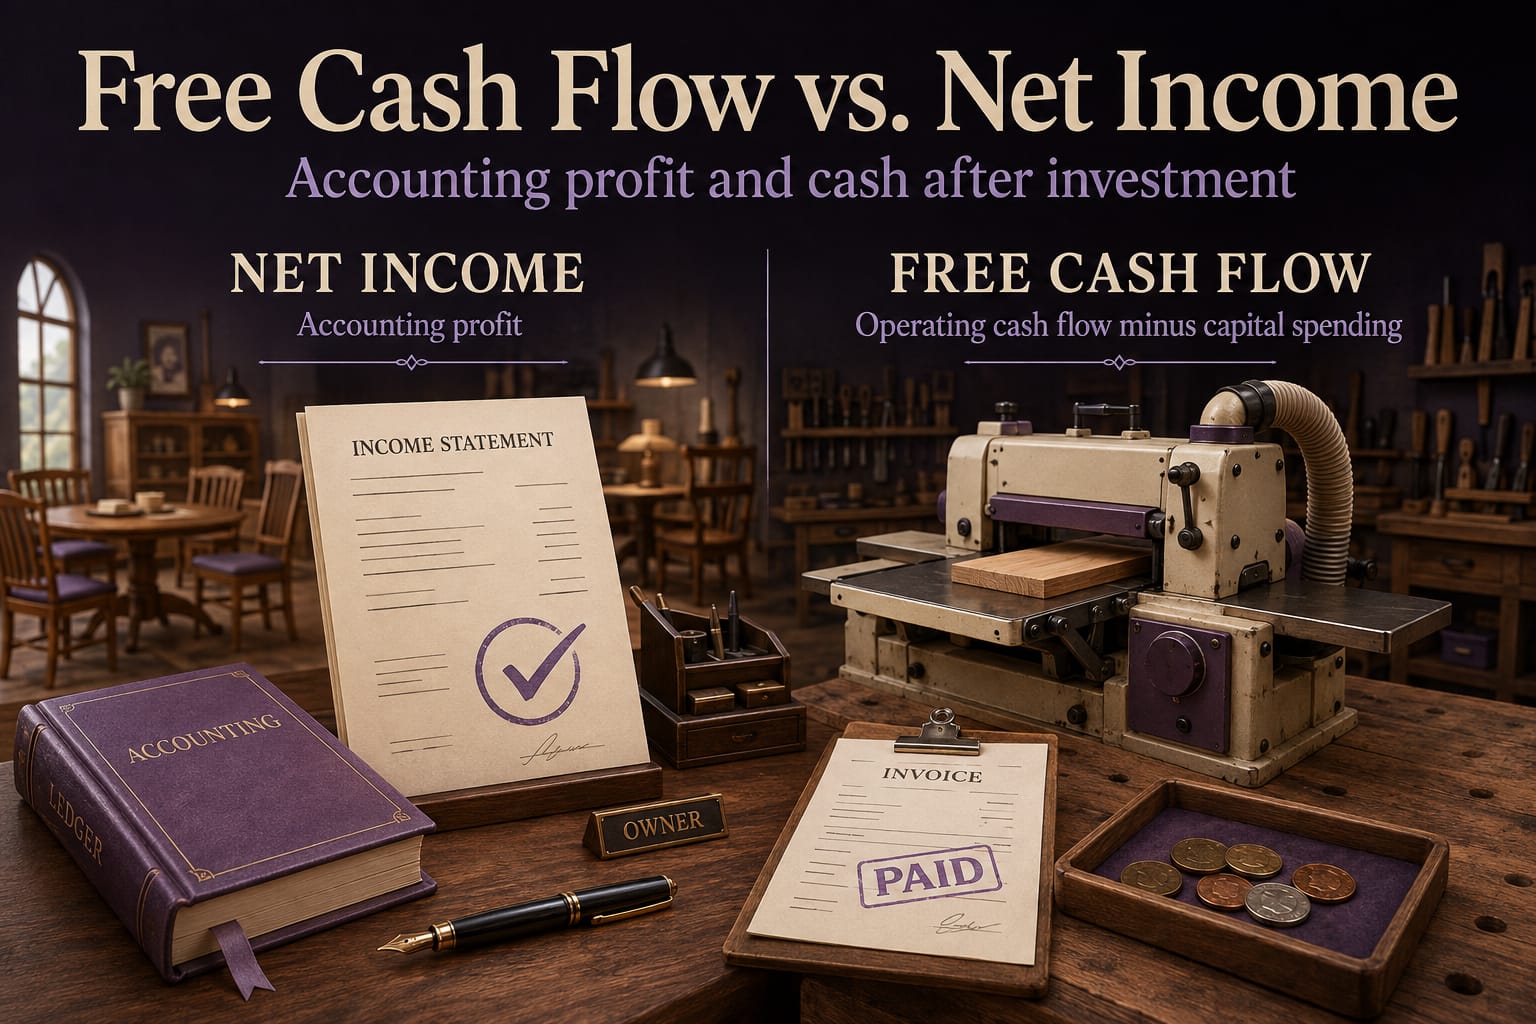
Free cash flow versus net income: an income statement represents accounting profit, while equipment, a paid invoice, and remaining coins illustrate operating cash flow minus capital spending.
1
0

BMW sets medium-term margin targets and plans leaner management structure

BMW ($BMW) outlined a target automotive operating margin of 3%–5% in 2028, alongside more than €5 billion of automotive free cash flow. It aims to reach an 8%–10% margin and over €7 billion of free cash flow in the early 2030s. Management also plans to reduce divisions and related leadership positions by 20% by the middle of 2027. The targets establish a proposed profitability recovery path while the organizational changes seek to simplify decision-making and lower structural costs. They are med

0
0

Marks Electrical raises profit expectations despite unchanged sales outlook

Marks Electrical ($MRK-LSE) now expects at least £3.75 million of adjusted EBITDA for the year ending March 2027, above market expectations, following stronger first-half profitability. Revenue is still expected to be broadly in line with expectations. Management attributed the improvement to operating efficiencies, tighter fixed costs and better product gross margins, rather than a disclosed increase in sales forecasts. The retailer also appointed Philip Luke De Villanueva as chief financial of

0
0

AOTI improves operating cash flow while Medicare expansion remains proposed

AOTI ($AOTI) reported 10.8% first-half revenue growth and a 16.6% increase in EBITDA to $3.6 million. Revenue growth excluding Arizona Medicaid was 18.8%, highlighting the difference between its underlying measure and reported performance. Operating cash flow turned positive at $0.9 million, compared with a $4.7 million outflow, while half-year net debt was $6.3 million. The wound-care company is focusing its commercial team on patient outcomes and representative productivity. A proposed Medicar

0
0

Payoneer extends Etsy payments agreement across 16 markets through 2029

Payoneer ($PAYO) renewed its cross-border payments partnership with Etsy ($ETSY) for three years, extending the relationship through 2029 across 16 existing markets. The service has supported tens of thousands of sellers since its introduction, allowing eligible merchants to receive US-dollar earnings, withdraw to local bank accounts and manage funds in more than 70 currencies. The renewal preserves an established marketplace distribution relationship for Payoneer and continuity of international

0
0